Flow · Trend · Momentum — combines four institutional flow indicators with trend and relative strength into a single A/D Score, firing color-coded entry, add, and exit labels on any ticker and timeframe.
All 9 signals. Entry and add signals appear below the bar; exit signals above. Priority when multiple fire at once: S1 → S2 → S3 → T1 → T2 → T3 → R1 → A2 → A3. (A1 + A4 removed in v3.7.9 — A1 was dominated by R1, A4 had no validated edge.)
A composite accumulation/distribution score from four institutional flow indicators plus price-to-MA position. Higher = more institutional buying pressure.
Each trigger is boolean. The total count (0–5) determines whether T1, T2, or T3 fires. More triggers = stronger conviction.
| # | Trigger | What it measures |
|---|---|---|
| 1 | Score Gate | Composite flow is in the accumulation zone |
| 2 | CMF Crossover | Money flow just turned positive — fresh accumulation |
| 3 | OBV Strength | On-Balance Volume rising with or against price (divergence scored extra) |
| 4 | Relative Strength | Stock outperforming the benchmark over the lookback |
| 5 | Trend Gate | Price is above the intermediate trend line |
Each warning is boolean. The count (0–6) gates S3/S2/S1 alongside the crossunder conditions. Dashboard color: green → yellow → orange → red as warnings accumulate.
| # | Warning | What it signals |
|---|---|---|
| 1 | Score Softening | Composite flow leaving the accumulation zone — institutional interest fading |
| 2 | Money Flow Negative | Chaikin Money Flow flipped — net outflows on the candle range |
| 3 | OBV Stalling | On-Balance Volume no longer rising — buyers not committing volume to up-moves |
| 4 | Below Fast EMA | Short-term trend broken — stock under the fast moving average |
| 5 | Below Intermediate EMA | Intermediate trend broken — more serious structural breakdown |
| 6 | RS Off | Stock underperforming the benchmark — relative strength gone |
How the signals interact across a trade. With the Profit-Taking Overlay on (default), the exit is a two-step scale-out plus a trailing stop (the Scale-out path below); high-volatility names take the Trail-only branch instead. S1/S2/S3 still print as advisory heads-ups in parallel. R1/A2/A3 bypass the entry lock and can fire any time the stage is active.
Trail-only variant — high-ADR names skip the scale-out
When PT exit mode is on Auto (by ADR%) (default) and the name is high-volatility (ADR% ≥ 5), the overlay rides the whole position on one wider trail from entry — no PT1/PT2 banking — and exits in a single shot on the trail stop or the −30% floor. That's why those names show only the trail line. Calm, low-ADR names follow the scale-out steps. Set the mode to Scale-out to force the ladder on every name.
R1 / A2 / A3 — run in parallel, bypass the lock
While locked, all three add signals still fire freely. R1 — ICT Phase 3 blast-off (the one breakout add). A2 pocket pivots & A3 pullback bounces require Stage 2 + a healthy A/D Score. All three also fire when not in position, so a late entrant can use any add signal as an initial entry — which then activates the S-exit cycle. (A1 + A4 removed v3.7.9 — see the validation note in the signals section.)
A backtest-validated exit engine that scales out into strength and trails the rest. When enabled (default), it owns the exit and the S1/S2/S3 ladder becomes advisory. Built because testing showed EMA-cross exits left most of the move on the table.
A read of who is moving the stock — "banker" (strong-handed institutional money) vs the "retail" crowd — shown as a thin color strip along the bottom of the chart plus optional dashboard rows. A richer VIEW of flow, complementary to the A/D Score, not a separate trigger.
What the strip looks like on the chart
Read it left-to-right as a rotation: deep pink = the crowd is holding the tape, grey = balanced, deep blue = strong hands accumulating. The colour is Banker − Retail bucketed into 9 levels — so it deepens as dominance grows, not as price moves. The ▴ above the strip marks the bull divergence: banker still pinned low while the pure-volume flow stack lifts off its 10-bar trough and the tape still looks weak — accumulation under a soft surface, which is exactly the handoff shown mid-strip here. There is no bear counterpart: the ▾ mirror failed validation (it over-fired on mid-trend pullbacks and missed every real top — RSI-50 banker stays high through an entire uptrend), sat default-off from v3.3.6, and was removed outright in v3.8.1. For tops, use the S3→S2→S1 exit cascade.
The live table (top-right by default) updates every bar. To stay compact, the four A/D component rows (MFI/CMF/OBV/U-D Vol) and the two MCDX rows are hidden by default (v3.4.8) — enable them in the Display group.
Reading this panel top-down
| Cell | What it says here |
|---|---|
| FTM (signal) | The live flag. T1+ = max-conviction entry with the validated VGB badge — the size-up cue. Reads WATCH when a coiling base is armed but nothing has fired, or — when idle. |
| A/D Score | 78 — accumulation zone (≥65 lime). Above the 70 gate that trigger #1 needs. |
| Triggers | 5/5 — all five entry triggers on, which is what makes this a T1 rather than T2/T3. |
| Warnings | 0/6 — nothing deteriorating. Colour escalates green → yellow → orange → red as they stack. |
| RVOL | 2.14x — well over the 1.5 threshold, so the volume qualifier is satisfied. |
| vs Bench | +4.82% — leading SPY, so the relative-strength trigger is on. |
| ADR% | 6.24% — above the 5% line, so this is a high-ADR momentum name: T3 is permitted and the PT overlay runs Trail-only under Auto. |
| EMA50 Ext | 2.1x ATRs above EMA50 — healthy, room to run. At ≥7x it reads "trim" (trim-into-strength, not a sell). |
| RMV | 8 tight — compressed range, so the label earns a [*] tag. ≤5 shows "VCP", >40 shows "ext" (chase risk). |
| Stage | Stage 2 — the only stage T2/T3 will fire in, and the one you want to hold in. |
| MCDX / Bank/Flow | B16 R4 + 72 ▲ — banker dominant and the volume flow stack rising: strong hands behind the move. Both rows are off by default (Display group). |
Hidden by default and not shown above: the four A/D component rows (MFI / CMF / OBV / U-D Vol). Turn them on in the Display group when you want to audit why the score is what it is.
Every cell, in detail
Based on the 150-bar SMA (≈30 weeks on daily). Determined by price vs the SMA and the SMA slope. Enable "No entry signals in Stage 4" to auto-block all T/A entries in downtrends.
Input groups below, each with sensible defaults and an in-app tooltip on every field. Most users only touch Signal Sensitivity, the Profit-Taking Overlay, and Display.
Real-world usage patterns and how to configure for different styles.
7.2x trim), take partial profits and tighten the stop — but don't full-exit just because it looks stretched. In strong momentum, extension persists: in testing the most-extended state had the highest forward returns. Reserve full exits for the trail stop or an S3→S2→S1 rollover. The overlay automates this.A MarketSurge-style CANSLIM workstation on your chart — IBD-style ratings, earnings power, RS line with new-high detection, and a 7-letter checklist gated by market direction. All ratings computed from daily data, so the panel reads right on any timeframe.
MarketMerge answers “is this a stock worth owning, and does the earnings power justify a longer hold?” — it builds the buy list and sets conviction. FTM handles the timing.
Moving Averages (chart timeframe — panel checks always use daily MAs)
RS Line (blue) + Blue Dot
Stock ÷ benchmark ratio (default SPY), anchored 250 bars back and scaled into the lower price window. Rising = outperforming; falling = lagging even if price rises.
● NEW HI.EPS Markers — the earnings-reaction read
Surp +8.3% ← vs consensus
Gap +4.2% · Vol 3.1x
Green = beat · Red = miss · Blue = no estimate
| Surprise | Gap | Vol | Read |
|---|---|---|---|
| Beat | Up | 2x+ | Institutions endorsing — supports a longer hold |
| Beat | Fades / gaps down | High | Sold into good news — favor selling into strength |
| Beat | Flat | Low | Unimpressed — power not rewarded |
| Miss | Down | High | Thesis broken — exit discipline applies |
Header
| Cell | Meaning |
|---|---|
| Vol / Avg | Today vs 50-day avg — confirm breakouts at 1.5x+ |
| Off Hi | % below 52w high (green ≥ −10%) |
| ATR | 21-day ATR % — the movement budget for stops & sizing |
Workflow cues (v2.1 — backtest-validated)
| Cue | Meaning |
|---|---|
| Size | Position-sizing ladder from the M-gate cohort test: FULL ▲ (UPTREND, 0–2 dist days) · FULL (UPTREND, 3–4) · HALF (PRESSURE) · NONE (CORRECTION). Validated on small/mid-cap momentum; large-cap leaders may treat CORRECTION as a follow-through watchlist instead. |
| FTM PT | Suggested FTM "PT exit mode" for this name: EPS accel ✓✓ → TRAIL-ONLY (let the runner run) · DECEL ▼ → SCALE-OUT (bank into strength) · else AUTO. Set FTM's dropdown per position — indicators can't set each other's inputs. |
| Next ER / Pre-ER | Days to the next scheduled report. Inside 7 days: HOLD full size only if EPS is accelerating AND the last surprise was positive; otherwise TRIM ½ before the print. |
| Edge x/4 | The four signals MM adds beyond FTM's own gates: C, A, EPS acceleration, M. (L/S/N/I largely overlap FTM's triggers — judge incremental conviction on these four.) |
Ratings (proxies — directional, not official IBD)
| Rating | Measures | Good |
|---|---|---|
| Composite | RS 35 + EPS 35 + SMR 15 + Acc/Dis 15 | ≥ 80 |
| RS 1M / 3M / 6M | Relative-strength ratings (1–99) vs the benchmark over ~21 / 63 / 126 days. On the strongest leaders all three peg at 99 — that's the point of RS Trend below | ≥ 80 |
| RS Trend | Is leadership accelerating? Last month's outperformance pace vs the 6-month average pace. ▲ RISE = pulling ahead faster (lean in) · ▼ FALL = the lead is shrinking, a sell-into-strength tell even while price rises · → FLAT = steady | ▲ RISE |
| EPS Rtg | Latest quarterly EPS growth YoY | ≥ 80 |
| SMR | Sales + Margin + ROE | A / B |
| Acc/Dis | 50-day up/down volume | A · B+ · B |
| 52w Hi / Lo | Each shows how far price sits from it, coloured by the criterion it tests. 52w Lo: green when ≥30% above the low (Minervini #6). 52w Hi: green within 10% of the high (CANSLIM N), yellow within 25% (Minervini #7), red beyond | both green |
| Neglect / 4% B/O | Stockbee's seller-exhaustion read. Neglect: no net price progress vs ~2 years ago — weak hands gone, no overhead supply. TURN ✓ when also ≥30% above the 52w low · DORMANT when the turn isn't confirmed · — not neglected · thin fails the liquidity floor. 4% B/O: bars since a one-day 4%+ gain on higher volume (the wake-up trigger) — green within ~10 bars. Backtested: the same 4% breakout carries more follow-through in neglected names. Context only — no score impact | TURN + recent B/O |
| MA stack | Close vs 8 / 21 EMA (institutional short-term) + 50 / 200 DMA — ✓ above (green), ✗ below (red) | all ✓ |
| MM Trend | Minervini Trend Template, scored x/8 — price > 50 > 150 > 200 DMA · 200 DMA rising ≥1 month · ≥30% above the 52w low · within 25% of the 52w high · RS ≥70. Hover to see which criteria are failing | 8/8 |
| RS Line | 20-bar direction / 52w high | ● NEW HI |
SPY daily trend + distribution days (SPY down ≥0.2% on higher volume, over 25 sessions — x/25, green 0–2 · yellow 3–4 · red 5+). Three of four stocks follow the market: M overrides everything.
| Letter | Pass condition |
|---|---|
| C Qtr EPS+Sales | Quarterly EPS ≥ +25% YoY and sales ≥ +20% YoY |
| A Ann EPS | Annual EPS growth ≥ +25% |
| N New Hi | Within 10% of the 52-week high |
| S Demand | U/D volume ratio ≥ 1.0 |
| L Leader | RS Rating ≥ 80 |
| I Quality | Composite ≥ 70 |
| M Market | Market status = UPTREND |
- Ratings are proxies. Directionally aligned with IBD, not the exact percentile numbers.
- Financials lag & differ.
request.financialupdates days after filings; TradingView uses GAAP EPS, IBD excludes non-recurring items. Verify C and A at the source before sizing up. - Surprise coverage thins on older history and small caps — blue markers mean no consensus estimate.
- Not on TradingView: fund-sponsorship counts (true “I”) and forward estimate revisions — track outside the chart.
- No lookahead. Live-bar panel values are provisional until the daily close.
The two indicators answer different questions. Run them together: MarketMerge for what to own and how long, FTM for when to enter and exit.
Neither discipline is complete on its own. Fundamental analysis finds companies worth owning but is famously bad at timing; technical analysis times entries precisely but cannot tell a real business from a story stock. TechnoFunda runs both as filters in series — and that is exactly the division of labour between these two indicators.
- Earnings & sales growth — quarterly acceleration (C, A, EPS Accel)
- Institutional sponsorship — Acc/Dis, U/D volume, RS leadership (I, L)
- Profit quality — margins, ROE, SMR rating
- Catalyst & demand — new highs, supply/demand, market direction (N, S, M)
FUNDADUAL FILTER
- Price trend — Stage 2 confirmed, above EMA 20/50 (Weinstein)
- Volume — RVOL, pocket pivots, the A/D money-flow score
- Constructive base — tight RMV, the pre-breakout WATCH pivot (VCP-style)
- Entry & exit — T1/T2/T3 ladder in, PT scale-out + ATR trail out
Avoiding the “value trap” — the fundamental flaw
The problem: great earnings on a chart stuck in a multi-year downtrend. The numbers look cheap all the way down.
Avoiding the “speculative bubble” — the technical flaw
The problem: a beautiful breakout in a company with no earnings behind it. The pattern is real; the business isn't.
This isn't theory bolted on afterwards — it is why the Selection → Timing → Management sequence below is ordered the way it is, and the M-gate cohort test further down is the measured version of the same claim: the fundamental/market filter roughly doubled per-trade expectancy on small caps, at the cost of taking fewer trades.
CANSLIM score, RS leadership, earnings acceleration, market-direction gate. Builds the buy list and sets conviction.
Money-flow A/D score, pre-breakout WATCH, T1/T2/T3 entries, R1/A2/A3 adds, and a Profit-Taking Overlay (scale-out + ATR trail) that owns the exit — S1/S2/S3 print as advisory. Executes the trade on names MarketMerge already blessed.
One chart, both indicators. MarketMerge occupies the left panel (selection & conviction), FTM Plus the right-hand dashboard plus every label on the price chart (timing & management). This is a real screen, not a mock-up — and it happens to catch the stack in its most instructive state.
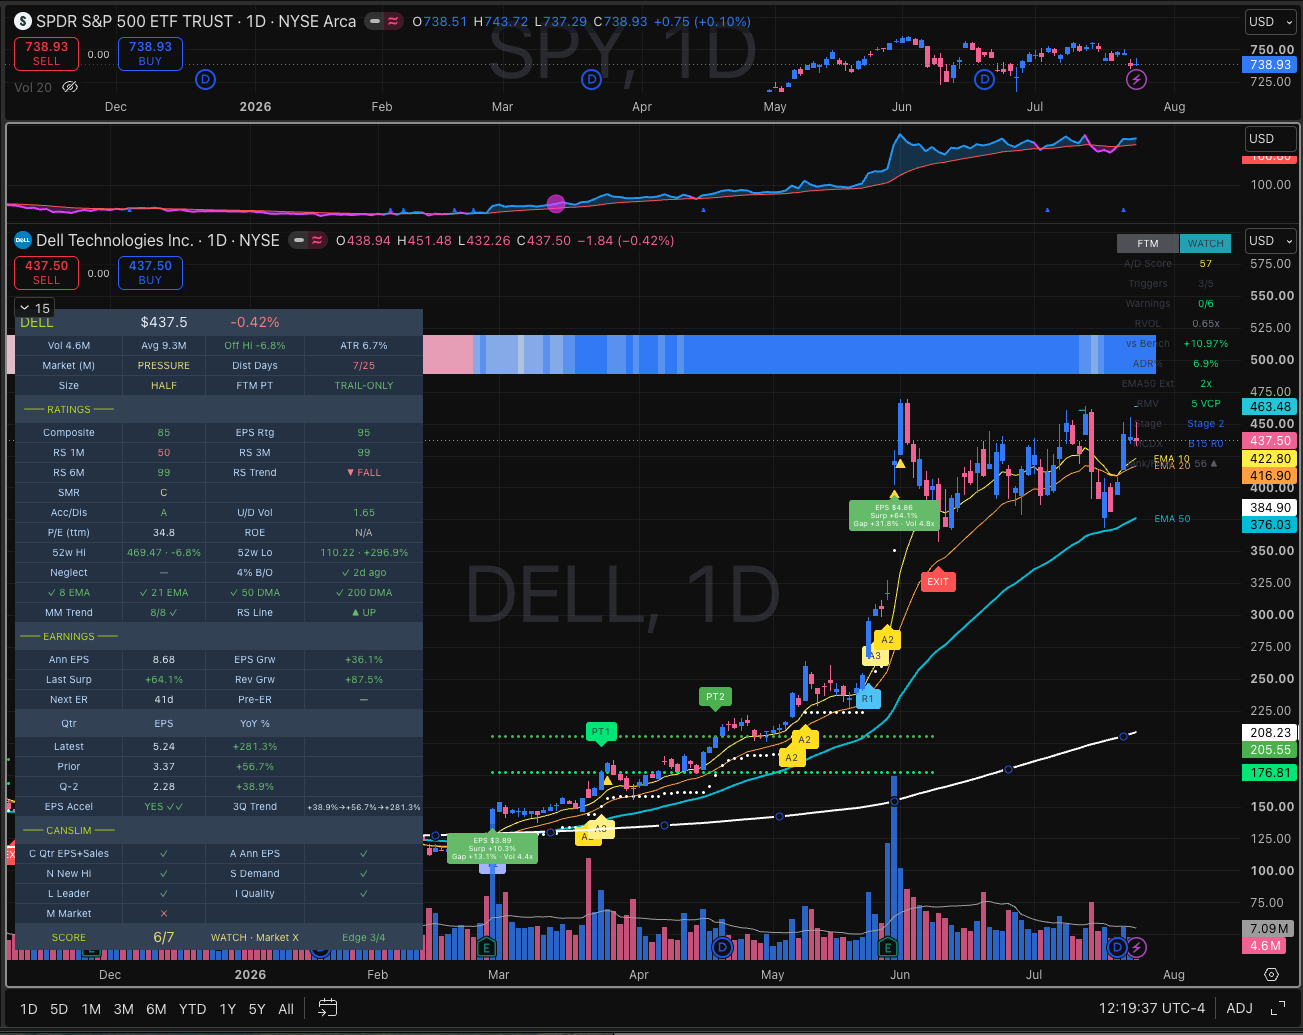
① Top pane — SPY
The market itself. This is what feeds MarketMerge's M (market-direction) gate and the distribution-day count — the switch that decides your position size.
② Left — MarketMerge panel
Ratings, CANSLIM checklist, earnings history and the workflow cues (Size, FTM PT, Next ER). Answers is this worth owning, and how hard to press.
③ Right — FTM dashboard
Flag cell, A/D Score, triggers, warnings, RVOL, RMV, Stage. Answers is the chart ready right now — the top cell here reads WATCH.
④ On the chart
FTM's labels — adds (A2/A3/R1), profit-takes (PT1/PT2), the red EXIT, dotted PT target/trail lines, EMA 10/20/50 — plus the blue MCDX banker strip along the top and MarketMerge's green earnings-reaction boxes.
Reading this exact screen
| What it says | Why it matters |
|---|---|
| Score 6/7 · Edge 3/4 but M ✗, "WATCH · Market X" | The company passes — EPS accelerating ✓✓ (+38.9% → +56.7% → +281.3%), MM Trend PASS, Acc/Dis A. The market does not: M is PRESSURE with 7/25 distribution days. One red letter, and it's the one that gates everything. |
| Size = HALF | This is the M-gate doing its job. Same name in a clean UPTREND would read FULL ▲. You are not being told to skip it — you are being told how hard to press. |
| FTM = WATCH RMV 5 VCP · Stage 2 · 0/6 warnings | No entry has fired. The base is coiling tightly — RMV 5 is the VCP zone, the tightest reading the indicator has — inside a confirmed Stage 2 uptrend with zero warnings. FTM is saying get ready, don't chase: rest a buy-stop at the pivot. |
| RVOL 0.65x | Volume has dried up into the coil — exactly what you want to see before a breakout, and why no T-tier has triggered yet (they all require volume). |
| RS 1M 50 vs RS 3M 99 RS Trend ▼ FALL | The fast/slow relative-strength split flags that leadership is cooling short-term even though the 3–6 month picture is near-perfect. Consistent with a pause, and a reason the Size cue isn't full. |
| FTM PT = TRAIL-ONLY | MarketMerge's cue for FTM's exit dropdown: EPS is accelerating, so let the runner run rather than banking at fixed targets. ADR% 6.9 puts FTM's own Auto mode in trail-only anyway — the two agree. |
| MCDX B15 R0 Bank/Flow 56 ▲ | The blue strip across the top: banker dominant, retail nowhere, volume flow rising. Strong hands are holding through the consolidation — confirmation, not a trigger. |
| MarketMerge says | FTM says | Play |
|---|---|---|
| EPS Accel ✓✓ · beat + gap up on volume · RS ● NEW HI | Above the PT trail, Stage 2, no warnings | Hold longer — let the trailing third run, ignore minor shakeouts, add on A3 pullbacks |
| EPS Accel ✓✓ | S3 advisory / EMA50 Ext red | Trust the overlay — bank the scheduled PT partials, keep the core. Strong earnings power earns the runner the benefit of the doubt |
| DECEL ▼ or beat-that-got-sold | Healthy (no warnings yet) | Sell into strength — scale out manually on up days; don't wait for the trail to be hit |
| DECEL ▼ or surprise miss | S2 / S1 advisory or PT Exit | Exit fully — fundamentals and flow agree |
| Anything | M flips to PRESSURE / CORRECTION | Tighten everything, no new buys, let the PT trail / S-exits run their course |
706 FTM signals (2021–2026, three universes) split by SPY's market-direction state at entry — same entries, same exits, one variable. If the gate has value, the UPTREND cohort must beat the rest on the very same trades.
• Large-cap leaders — the gate adds nothing there (p=0.35); CORRECTION entries on quality names were the BEST cohort (+20.7%, 72% win)
• Never missing a runner — every breakout gets taken
• Bear tape — took ZERO trades in 2022 while ungated FTM lost −10.1%/trade
• Junk protection — loser-basket loss streak cut 18 → 4, win rate 39% → 49%
• Reliability: higher PF, shallower worst-5, beat FTM-alone every year on small caps
| Universe | UPTREND | PRESSURE | CORRECTION | Verdict |
|---|---|---|---|---|
| Small-cap momentum (n=318) | +19.5% | +9.3% | +0.5% | Gate is real — p=0.003, monotone, repeats every year |
| Large-cap (n=231) | +11.6% | +8.4% | +20.7% | Gate unnecessary — corrections on leaders were buys, not vetoes |
| Loser basket (n=157) | +8.8% | +3.0% | −9.6% | Protection — directional (p=0.13), streaks 18→4 |
| Market state | Small/mid-cap momentum | Large-cap leaders |
|---|---|---|
| UPTREND · 0–2 dist days | Full size, lean in (cohort +36.7%) | Full size |
| UPTREND · 3–4 dd | Full size (+14.6%) | Normal |
| PRESSURE (5+ dd or < 50 DMA) | Half size / starters (+9.3%) | Normal — gate not needed |
| CORRECTION | No new buys (+0.5% = dead money) | Watchlist → buy the follow-through |
This ladder is what MarketMerge v2.1's Size cue prints. It keeps ~86% of small-cap trades (vs 31% under a strict UPTREND-only gate) while cutting the cohort that made nothing. Caveats: close-based fills, no costs, survivor-tilted baskets, one bear in sample — read direction, not decimals.